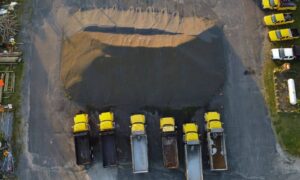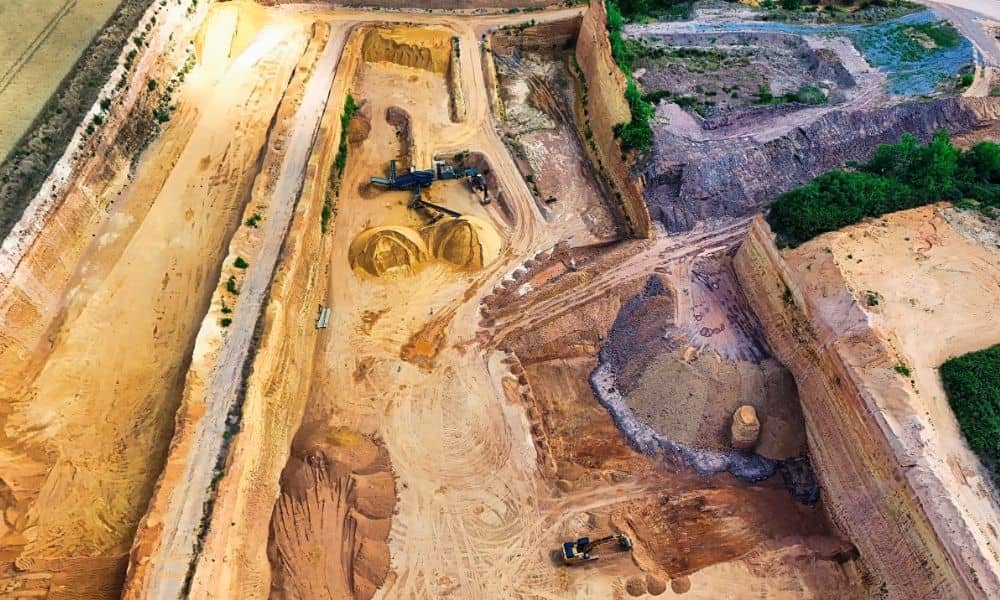
A stockpile can look the same from week to week and still hold a very different amount of material. Piles shift and settle. Loaders reshape them almost every day. A quick visual guess rarely matches what is really inside the pile. For plant managers, quarry operators, and bulk material handlers, that gap can cause real problems. It can lead to bad inventory numbers, disputes over shipments, or a bad surprise during an audit. LiDAR mapping fixes this. It turns an uneven pile into a precise 3D shape. This gives facilities a volume number they can trust and repeat over time.
Why Industrial Stockpiles Are Difficult to Measure Accurately
Stockpiles are not simple shapes. Even a pile that looks like a cone from far away has uneven sides. Loaders flatten the top. Some spots get packed down. Other spots slump or wash out. Old estimating methods often treat the pile like a perfect cone or triangle. They multiply a rough base size by a guessed height. Real piles almost never match that shape.
Hand measurement also runs into access problems. Big piles can stand twenty or forty feet tall. Walking around the base or climbing the pile is risky. It also leads to mistakes. Ground survey tools can capture some detail. But they take more time. They often miss the top of a tall pile. The result is a number that might be close. Close is not the same as accurate, especially when money, contracts, or reports depend on that number.
How LiDAR Mapping Turns Stockpiles Into Measurable 3D Surfaces
LiDAR mapping uses laser pulses to measure a pile’s surface. A drone usually carries the laser over the site. Each pulse sends back one data point. That point has an exact spot and height. Put together, millions of these points form a point cloud. This point cloud shows the true shape of the pile, slopes, flat spots, and all.
Once the point cloud is processed, it becomes a digital model of the pile’s surface. Software compares this surface to a known base level. This gives a volume number. It works much like a topographic survey calculates cut and fill for dirt work. Because the drone captures the whole pile in one flight, the volume reflects how the pile actually sits. It is not a guess based on a few ground points.
This method also handles odd pile shapes well. Some piles merge together. Some have ramps cut into one side from loader traffic. Some sit on sloped ground. A flat guess cannot account for any of that. A 3D model can.
Establishing the Base Surface Beneath an Irregular Stockpile
Volume math depends on knowing where the pile actually starts. If the ground under the pile is uneven or has settled from the weight of the material, using one flat base number for the whole pile can throw off the final volume.
Good results need a base surface that matches real ground conditions, not a flat guess. This base can come from an earlier scan of the same spot before material was placed. It can also come from visible ground near the pile’s edges, or from known site grading data. Facilities that want to track stockpile volume over time should capture this base surface early. It becomes the reference point for every future scan.
Managing Occlusions Around Equipment, Walls, and Adjacent Piles
An occlusion happens when something blocks the laser from reaching part of the pile. Walls, parked equipment, conveyors, and nearby piles can all create shadow spots. No data gets collected there during the scan. If nothing is done about this, those shadow spots can make the volume look smaller than it really is.
Good flight planning helps fix this. Flying the drone at different angles, or changing the flight path around known blockers, captures more of the pile’s surface. If a small gap still remains, the surveyor may fill it in based on the surrounding shape. In some cases, ground data can fill the gap instead. Facilities with piles near walls, buildings, or other piles should point these spots out ahead of time. This lets the surveyor plan the flight around them.
Using Repeat LiDAR Mapping for Industrial Inventory Decisions
One scan gives a snapshot in time. Repeat scans, done on a regular schedule or before and after big material moves, give facilities something more useful. They give a record of how volume changes over weeks or months. This helps with inventory checks. It helps confirm that shipped or received amounts match what actually moved. It also gives operations teams a clearer view of how fast material turns over across the site.
Repeat scans also make it easier to catch problems early. If a pile’s volume does not match expected numbers, that gap is easier to check with steady scan data than with a one-time guess. For facilities running several piles across a large yard, this kind of steady measurement can support internal reports, insurance records, and talks with buyers or suppliers who want confidence in the numbers.